Table of Contents:
Create a Report
To start building your report, follow the below instructions:
- In your HubSpot account, navigate to Reporting & Data > Reports.
- In the upper right, click Create report.
- Under "Create Reports from scratch" section, click Custom Report Builder.
- Click Choose my own data sources or Start with a dataset based on your requirement.
Creating a Report in the Custom Report Builder can be broken down into the following steps:
- Select the Report's Data Sources: Choose the criteria you'd like to use for filtering your data, such as Companies, Contacts, or Deals.

- Add Fields (Properties) to the Report: Select the specific property, event, and activity data to report on.
- Customize report filters: Set limits and boundaries for the fields you've added.
- Configure report visualization: Choose how you want data to be displayed.
- Save or export the report: Make your report available for yourself and others to view, or export it to take your data offline.
If you're unsure about the best chart type to use for your report, you can utilize the smart chart feature to help you out. By enabling smart chart before adding your fields, HubSpot will suggest a suitable chart type based on the fields you include. Once you choose a recommended chart type, HubSpot will automatically organize the fields into the appropriate channels for you.
Select data sources
Data sources refer to the specific objects, assets, and events that you choose to include in your report. The primary data source serves as the main focus of the report, with all other data sources connected to this primary source. A custom report has the flexibility to incorporate up to five different data sources.
To select your data sources manually:
- Choose the primary source by clicking on the dropdown menu labeled "Primary data source" and selecting the primary data source for your report.

- Select secondary sources by choosing from the CRM, Marketing, Sales, Service, and Custom objects (Enterprise only) sections.
- To select a sample report:
- Click the Sample reports tab.

- Click the Sample reports tab.
-
- Browse or use the search bar to view the available sample reports. The sample reports are organized in order of relevance, taking into account the primary and secondary data sources that you have selected.
- To build the report, select the sample report, then click Next in the upper right corner.
- In the report builder, click Save to save the report as it is or you can customize the report.
- At any time, you can view more sample reports by clicking Sample reports in the upper right of the report builder. Then, in the right sidebar, select the sample report you want to view and click Apply.
- After selecting your data sources, create your report by clicking Next in the top right corner. You'll then be brought to the report builder.
- You can update your data sources at any time in the report builder by clicking Edit data sources in the left sidebar.

Add fields
Select specific properties, activity measurements, and events to add data to your report. The amount of fields you can add to a report depends on the report type:
- Vertical bar, line, and area charts: You can add a maximum of twelve fields on the Y-axis and one on the X-axis, or one each on the X and Y axis and one Break down by.
- Horizontal bar: You can add a maximum of twelve fields on the X-axis and one on theY-axis, or one each on the X and Y axis and one Break down by.
- Combination charts: You can add a maximum of four fields.
- Donut, pie, KPI: You can add a maximum of thirty value fields, or one value field and one Break down by.
- Gauge: You can include up to one value field in your report.
- Pivot table: You can add a maximum of thirty fields, with a maximum of four rows and four columns.
- Table: You can add a maximum of thirty fields.
Please note: Event fields can be seen under the Events section in certain data sources. Currently, you can only pick one event field for the custom report, and the data in this field will automatically be limited to a certain time range.
To add fields to the report:
- In the left panel, use the search bar, click the Browse dropdown menu or click the Filter fields icon and select the data source with the field you want to add. Hover over the property and click Actions > View property info to view the property details, description and the property edit history.
- Click and drag fields from the left sidebar into the channel slots in the Configure tab, or click Actions > Add to [X].
- If you have smart chart enabled, all fields will be added under the Columns header by default. For all other chart types, available channels will vary by chart type:
- X-axis: The horizontal line in the report.
- Y-axis: The vertical line in the report.
- Break down by: The sections or categories in the report.
- Values: The amount, quantity, or value of the report (i.e., what is being counted).
- Group by: The sections or categories in the report.
- Columns: The columns in the report.
- View point details by: For scatter plot charts, this channel breaks down data by creating points on the chart as per the specified field. While Break down by will create points organized by color, this slot will organize all data without color or additional mappings. Use this channel instead of Break down by when reporting on larger data sets. This accepts dimension fields.
- View point size by: For scatter plot charts, use this channel to add a third numeric value to the chart and automatically scale the data with bubbles in the visualization. This accepts measure fields.

Please note: Including a field with a large amount of data in the "Break down by" channel can lead to the report being unable to load properly. To prevent issues, it is important to avoid exceeding 99 values in the "Break down by" property. Reports that surpass this limit will not be able to display on dashboards and will need to be viewed within the reports tool.
Fields in a report can be categorized into two types, each indicating whether an aggregation is applied to the field's data:
- Dimensions: Fields with no aggregation are displayed in grey color. Dimensions can be of any data type, including dates, numbers, Booleans, and strings. This type of field can only be added to the X-axis and "Break down by" slot.

- Measures: Fields with a set aggregation method are displayed in green color. Measures are typically numerical or quantitative values, such as the number of associated deals. This type of field can only be added to the Y-axis. You can add up to ten measures to one report.

Setting an aggregation type on a field can be helpful if you want to return the field's data in a specific way, such as a sum or an average. For example, To analyze which types of deals generate the most revenue, you can view the total sum of revenue for each deal type. Explore further to learn about different aggregation methods that can help you gain insights into your data.
Please note: The aggregation method for default measures, such as Count of deals, is set to Distinct count and cannot be adjusted.
- To edit a field, click the
 down arrow icon next to the field. In the dialog box, edit the field's details, depending on the type of field:
- Name: Change the field's name for this report.
- Aggregation: The field's aggregation method.
- Sort: For fields with no aggregation type, select the value and order that the field's data is sorted by.
-
-
- Label: Sort the field's data by its labels in ascending or descending order.
- Value: Sort the field's data by its values in ascending or descending order.
- Display order: Sort the field's data by the order that its values are displayed in HubSpot.
- Count of records: If your report includes a default measure, such as Count of contacts or Count of companies, sort the field by that default dimension.
-
-
-
Limit: For fields with no aggregation type, set a limit to the number of values added to the report from this field, such as Top 10 or Bottom 20.
- Format(beta): Edit how decimal places, negative values, and thousand separators are used for the selected number field. Using this measure, relevant fields can be displayed as currencies or percentages.
-
- By default, report data will refresh as you make adjustments. To prevent the report from refreshing, Check Refresh as I make changes checkbox above the report. You can then manually refresh the report by clicking the
 refresh icon.
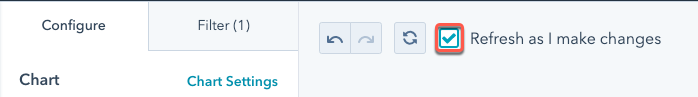
Save your report
Once the report is set up, save it to your reports list, dashboard, or export the data from HubSpot.
To save the report to your reports list or a dashboard:
- In the upper right, click Save. To save your report as a copy, click Save as.
- In the right panel, enter the report name into the Report name field.
- Select where you want to save the report:
- Don't add to dashboard: The report will be added to your reports list.
- Add to existing dashboard: The report will be added to an existing dashboard. To select the dashboard to add the report to, click the dropdown menu.
- Add to new dashboard: The report will be added to a dashboard you'll create. Enter the dashboard's name, and select its visibility.
- In the bottom right, click Save.
You can also export a report to take your data offline. When configuring a report for export, all fields in the Fields section will be included as columns in the export. All fields in the report will export with their original name, even if you've changed the name in the report builder.
To export a report:
- In the upper right, click Export.
- In the dialog box, enter the name of the export, then select the File format in which you want to save the report as. Click Export. The file will begin processing, and you'll receive a notification once the report is available for download.
Drill Down Reports
Drilling down into reports in HubSpot allows you to gain deeper insights by breaking down your data into more detailed views. Follow these steps to effectively drill down into your reports:
- Navigate to Reports: In the main navigation menu, click on "Reporting and Data" and then select "Reports" or Go to the "Dashboard" where you want to analyze reports.
-
Choose Your Report: From the "Reports" Home, select the report you wish to drill down into.
-
Interact with the Data:
-
Click on Data Points: Within the report, click on any data point, chart, or table entry that you wish to explore further.
- Use Filters: Apply filters to narrow down the data to specific criteria, such as date ranges, contact properties, or deal stages.
-
- View Detailed Information: The system will display more granular data related to the selected data point. For example, if you're looking at a bar chart of sales by region, clicking on a bar representing a specific region will show detailed sales data for that region.
- Export or Save as report:
- Export Data: If needed, you can export the detailed data for further analysis or sharing. Click on the "Export" button and choose the desired format (e.g., CSV, Excel).
- Save as report: If needed, you can save the detailed data as a report by clicking on "Save as report".
Note: To adjust the columns you want to see in the drill-down report can be done by adding or removing fields of your interest in the "Fields" section of report builder.
Level of Drilling we can perform in HubSpot (Basic Reports, Custom Reports, Dashboards)
- HubSpot typically offer limited drill-down capabilities, often just one or two levels.
- With custom reports, especially those built using the custom report builder, you can perform more detailed drill-downs. You can often drill down several levels, depending on how you structure your report and the data sources you are using.